General
Corrosion is the deterioration of a metallic material by chemical (or electrochemical) attack. This is normally caused by the environment (most often water), and sometimes by another material. The corrosion products generated are not electrically conductive, so we will be measuring the thinning of the material under test.
An eddy current instrument and probe can be used for detection, and, using a specific procedure, it is often possible to perform a quantitative measurement.
There are several types of corrosion:
- Uniform corrosion that extends evenly across the surface
- Pitting corrosion that is uneven has smaller deep areas (pits)
- Exfoliation corrosion that moves along layers of elongated grains
- Intergranular corrosion that grows along grain boundaries
In most situations, particularly in the aerospace industry, the material under inspection will be a type of aluminum alloy, so we will concentrate on this application. Corrosion in steel is not normally detectable with eddy currents, although there are some exceptions, such as the use of the reflection remote field technique, mostly for tubing inspection.
Equipment Selection
Instruments: For corrosion detection it is best to choose instruments with high gain and low drift, preferably operating in the reflection (transmit-receive) mode. The availability of a low-pass filter (LPF) is also a useful feature that reduces the background noise that appears with some probes and often appears at high gain settings.
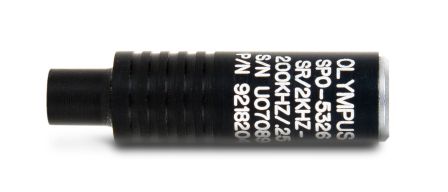
Probes: The best probes are usually reflection spot/surface types with small diameters below 0.5 in. (12mm), although larger sizes are sometimes used to cover larger areas. Special low noise, high gain reflection models are specially designed for aluminum corrosion detection.
Reference Standards: Calibration can be done using a step wedge type of reference standard of similar conductivity and thickness as the areas to be inspected. Areas of reduced thickness of 10%, 20%, and 30% are the most common.
The Impedance Plane
It is important to see the effect of thickness on the conductivity curve, as it shows the movement of the dot on the instrument display. Figure 1 shows the typical impedance plane, with the inductive reactance (XL) and resistance (R) as coordinates. With the probe in the air, the dot is at the top of the conductivity curve, and it moves down along the curve for increasing material conductivity with point B as the aluminum alloy to be inspected. Starting at point B, a reduction in thickness will follow the thickness curve upwards. In Figure 2 we have rotated the display (using the phase control) to set the liftoff horizontal and increase the instrument gain until only the area in the rectangular portion becomes the full display screen of the instrument. If point C along the thickness curve represents a 20% thickness reduction, the dot will move from B to C as the probe moves over the corrosion spot. |  Figure 1 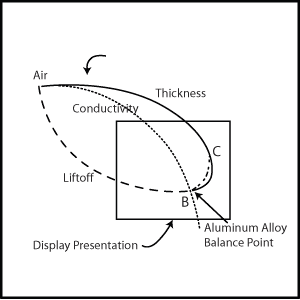 Figure 2 |
Single Layer Corrosion Detection
This is the easiest of the possible situations. When only one layer is present, it is possible to achieve high sensitivity detection and percentages as low as one percent loss can be displayed. Nevertheless, when using such high gain, other variations such as conductivity and even aluminum sheet rolling variations can be seen, although these are usually noticed as very slow changes. The frequency is not critical, but it is conventional to set it for one standard depth of penetration. For this inspection, it is preferable to have a reference standard (of the same or similar material) with areas that have thickness reductions of 5, 10, and 20%, as this allows for a better estimation of shallow corrosion (see Figure 3). The display in Figure 4 shows the indications produced by these reductions along the thickness curve. Corrosion estimates are made by comparing the readings. It may be necessary to re-null the instrument on the material under test after calibrating to the standard, due to the conductivity difference. The gain should not be readjusted. | 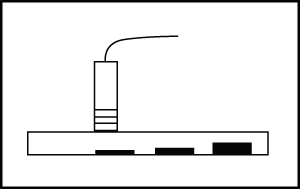 Figure 3  Figure 4 |
Two Layer Corrosion Detection
When two aluminum sheets are joined together, it is more difficult to detect (and even more difficult to measure) corrosion. The main issue with measuring corrosion on two layers is the interference of the airgap variations between the skins that can be confused with the presence of corrosion. To the probe, the airgap looks like a thickness reduction, and although it follows a slightly different path, in practice this is insufficient for positive identification. This is further complicated by the fact that corrosion products also create an airgap.
There are three different techniques that can be used for corrosion detection and measurement:
- The Limited Penetration Method
- The Dual Frequency Method
- The Variable Frequency Method
The Limited Penetration Method
This method relies on limiting the penetration to the first layer only, therefore avoiding any confusing airgap indications. The main limitation of this method is the low eddy current density at the far side of the first layer, making sensitivity to corrosion below 10% low. Fortunately, corrosion levels above this value is readily seen. As the frequency is increased, the thickness indications move clockwise. Figure 5 shows the effect of probe movement from the two skin area (B) to the single skin area. Eventually a frequency is reached where the indication becomes horizontal and there is no vertical amplitude difference between the two (movement B to C). Normally a chart is provided that relates thickness to the frequency of inspection. The operating point corresponds to approximately 1.5x the standard depth of penetration (you can use the Nortec® eddy current slide rule to calculate this). The standard corrosion detection procedure in the airline NDT manuals relies on this method and uses calibration standards of 10, 20 and 30% thickness reduction (Figure 6). The expected display presentation is shown in Figure 7 with some horizontal gain reduction of about 6dB. Due to variations in the nominal skin thickness, conductivity variations, and probe differences, it is also necessary to check the response on the structure to be tested. As mentioned earlier, this is done by placing the probe on a two-layer area and then a single-layer area. The dot should give the same vertical position for both, helping to ensure minimum interference from the second layer. The gain should not be readjusted. | 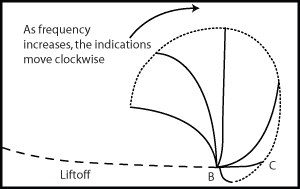 Figure 5 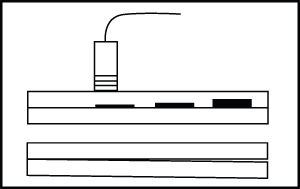 Figure 6 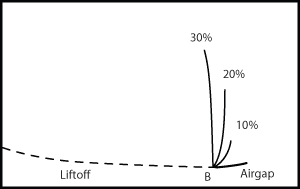 Figure 7 |
Dual Frequency Method
To perform this inspection, it is necessary to have a dual frequency instrument and a probe that has a wide frequency range. The dual frequency method uses two separate frequencies to cancel the airgap signal. The second frequency, normally only twice the inspecting frequency still provides enough penetration to inspect both layers. In addition to the conventional type of reference standard, a varying airgap is also needed for calibration purposes (sheets of paper are satisfactory), as seen in Figure 6. The airgap signal detected with the second frequency F2 is adjusted to be as close as possible in amplitude and phase of the one obtained with the first frequency and then the two signals are subtracted from each other (F1-F2), thereby minimizing the airgap signal (Figure 8). Although the cancellation reduces the corrosion signal as well, there is enough phase and amplitude difference to make it detectable. Corrosion on the far side of the second layer can also be detected. Measurement of the corrosion severity is accomplished by comparison to the reference standard. The corrosion indications will look similar to Figure 9. The main objection to this method is that the calibration has to be done with care and is time consuming. This method works better with thin layers than thick skins. | 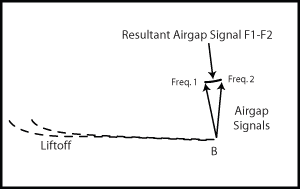 Figure 8 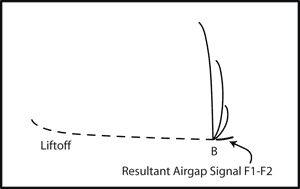 Figure 9 |
The Variable Frequency Method
This method is used for measurement only. The detection is done first using a frequency capable of penetrating the two layers under inspection. To do this, it is best to add their thicknesses together and use the standard depth of penetration (see the single thickness procedure described earlier in the document). As long as no rejectable signals are detected, the structure is considered acceptable. When a suspect area is identified, the worst spot is carefully marked on the surface, and then inspected further by comparing to a known good spot used as the null point. This should be as close as possible to the point of interest to avoid other variations (see Figure 10). At each frequency step, the probe is nulled on the good spot (and the liftoff set to horizontal), and then placed on the marked suspect spot. As the frequency is increased, the suspect corrosion spot will move clockwise (see Figure 11) until it reaches the same vertical amplitude as the null point (it will be in line and to the right of the liftoff line). | 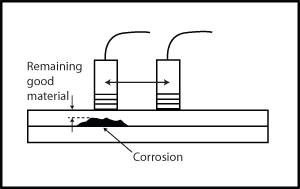 Figure 10 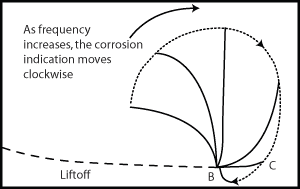 Figure 11 |


