1. Background
A vehicle’s overall quality is equal to the sum of its parts, and it is imperative for manufacturers to maintain rigid standards of excellence for every component. Manufacturers must also take into account requirements such as emission reduction, fuel efficiency, long-term durability, and regulatory standards. The increasing complexity of auto parts and components also requires manufacturers to place a strong emphasis on material characteristics, fitting tolerances, and technical cleanliness, which all play a strong role in the long-term durability, durability, and life-expectancy of the final product.
Particle contaminants can directly affect a part’s reliability, especially when the part is assembled using components from multiple suppliers. As systems and components shrink, even the smallest particles can cause catastrophic failure, making it essential to assess the technical cleanliness and integrity of components and liquids.
2. Application
During production, manufactured metal parts are processed including cutting, grinding, and deburring. Serious, system-wide problems can occur if metal chips and other foreign matter produced during cutting, grinding, and deburring are not properly cleaned and removed from critical systems. (e.g. crankshaft bearing clamps, valve blockages, nozzles, injectors, filters, or electronic parts). The entire system is subject to failure if any part of the fuel system, braking system, hydraulic circuit, or electronics doesn’t meet cleanliness requirements.
To help ensure part and system cleanliness, the contaminant particles are first separated from the components using an extraction cabinet in a clean room. The contaminants are removed from the parts via a liquid shower or an ultrasonic bath. The washing rinse is then filtered through a membrane to extract the particles. The filter is clamped in a holder and dried for further analysis, then mounted on a microscope’s stage for image acquisition and examination.
Since dedicated magnification can limit the camera’s field of view, 0larger particles might be split between two or more images. To ensure that they are only detected once, each particle can be described by different parameters. The most important of these are the maximum Feret diameter and the equivalent circle diameter, both of which measure the particle’s length. Other particle parameters can be used to measure a particle’s area, shape, and reflectivity. These traits are used to recognize special particle families, like fibers and reflecting particles. Distinguishing between metallic and non-metallic particles is based on the different behavior of the reflected light.
The particle detection process results in a sheet highlighting the size (typically the maximum Feret diameter) of each particle. . Particles are grouped into different size classes to simplify the report and provide a better comparison of the measurements. The absolute or extrapolated count of particles must be normalized on a reference value. Depending on the standard used and the filter being tested, the number of particles is normalized to a comparison value. This enables users to compare multiple measurements, even if the samples are different sizes. Classification parameters and class division are defined in various international standards. Automotive industry size classes are defined by minimum and maximum particle size. Each particle is placed in only one class. A typical standard with differential size classes is VDA 19.1:
- Class D: all particles where the maximum Feret diameter is larger than 25 µm but smaller than 50 µm
- Class E: all particles where the maximum Feret diameter is larger than 50 µm but smaller than 100 µm
- Class F: all particles where the maximum Feret diameter is larger than 100 µm but smaller than 150 µm
Under this standard, a particle with a diameter of 75 µm will be placed into size class E. Finally, the system generates a report containing all measurement results and data for the filter membrane.

Figure 1. Extracting contaminant particles for inspection.
3. Olympus metallic and non-metallic solutions
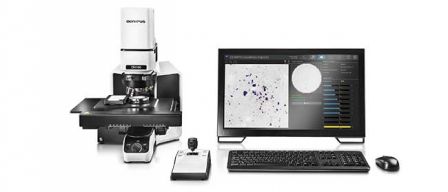
Designed to meet the cleanliness requirements of modern industry and national and international directives such as VDA 19.1 and ISO 16232, the OLYMPUS CIX100 is a dedicated, turnkey system for counting, analyzing, and classifying micron-sized contaminant and foreign particles down to 2.5 µm. The system’s all-in-one-scan solution enables scans to be completed twice as fast as other inspection systems since metallic and non-metallic particles are detected simultaneously. All counted and sorted particles are displayed live while powerful tools make it easy to revise inspection data. The system’s intuitive software guides users through each step of the process, allowing even novice operators to quickly and easily acquire cleanliness data. While metallic particle detection historically requires users to capture two individual images (a time-consuming process) by rotating an analyzer by 90° the OLYMPUS CIX system recognizes reflective and non-reflective particles in a single scan.
 Figure 2: The incident light on the filter membrane and on the non-metallic particles is scattered diffusely. No matter the incident light, the "reflected" light is not polarized. Even if the incident light is polarized, there is no effect when analyzing the polarization. The filter membrane is always brighter than the particles on it.
 Figure 3: When the incident light hits a metallic particle, it produces a real reflection. The light reflected off a metallic surface does not change the polarization of the light. This difference is exploited in the "classical" method of cleanliness inspection. The polarization of the reflected light can be analyzed by the camera and software. Metallic particles are very bright when the polarizer and analyzer are set to parallel.
The OLYMPUS CIX system work differently (Figure 4). The incident light beam is also polarized. The polarization of one band of the light spectrum is changed using a retardation plate. As a result, the polarization of the incident light is different for different colors (Figure 5).
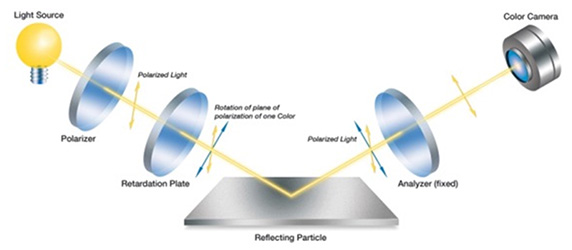
Figure 4a: The diffuse reflection of non-metallic particles or the filter membrane is identical to the classical setup. The reflected light is non-polarized in all color ranges and does not need to be analyzed. The filter membrane is brighter than the dark particles on it.
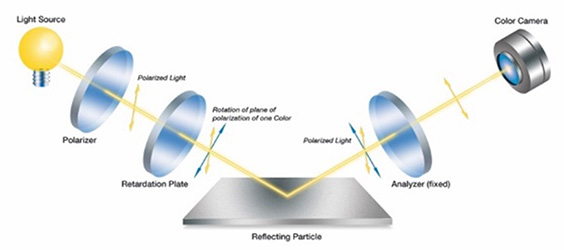
Figure 4b: The reflection of metallic particles also follows the classic principle and preserves the polarization of the light. But because the polarization of each color is known, it is possible to detect metallic particles directly in the color image. Metallic particles get bright only for a special color.

Figure 5: Only one color image is required to separate reflecting (metallic) and non-reflecting (non-metallic) particles. A second scan is not required, which saves time. Additionally, no mechanical parts need to be rotated, saving wear and tear on the instrument.
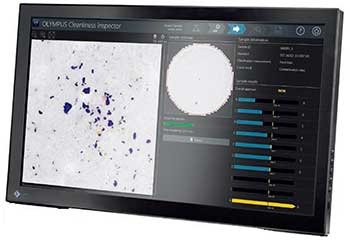
All relevant data, including live and oveview images, are displayed live on a single screen during the inspection to enable the operator to stop or interrupt the inspection if a filter membrane shows too many contaminants (Figure 6). The system counts and sorts reflecting and non-reflecting particles into size classes defined in the inspection configuration and selected standard. The OLYMPUS CIX100 system supports major international standards used in the automotive industries including:
- ISO 16232-10 (A) (N) (V)
- VDA 19.1 (A) (N) (V)
- ISO 4406
- ISO 4407
- ISO 12345
- NAS 1638
- NF E48-651
- NF E48-655
- SAE AS4059
A statistical control chart function visually illustrates the level of particle class compliance for improved reliability. Thumbnail images of every contaminant detected by the system are linked together with dimensional measurements, making it easy to review the data. Users can easily retrieve the information for a particular contaminant.
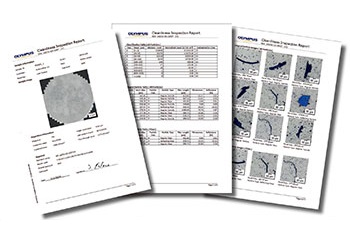
The OLYMPUS CIX100 system delivers enhanced performance and productivity throughout the entire inspection process. Intuitive workflows and step-by-step user guidance help reduce cycle time, cost-per-test, and handling errors. Smart report tools use predefined templates that comply with industry standards. The results are created in Microsoft Word 2016 and can be exported as a PDF (Figure 7). The templates help inexperienced users avoid mistakes, but can be easily modified to suit the needs of any operator. The scanned membrane is automatically saved for reprocessing or recalculation.
Figure 6. Image processing discriminates between contaminant types captured by the Technical Cleanliness Inspection System. |
Figure 7. A cleanliness analysis report. |
