Application Considerations in Specifying High Frequency Ultrasonic Transducers
by Grant Reig, Dan Kass, and Tom Nelligan
Advances in transducer manufacturing technology and associated instrument electronics have led to the introduction of commercial products that provide the capability for ultrasonic imaging, thickness gaging, flaw detection, and material analysis at test frequencies greater than 50 MHz. In many materials like fine grain metals, ceramics, and thin polymers, these higher test frequencies permit measurement of significantly lower thickness limits and detection of significantly smaller flaws and
other internal structures as compared to conventional test frequencies of 20 MHz and below. However, when working in this very high frequency range, it is especially important to consider a number of fundamental performance factors when selecting transducers. These include echo recovery time as determined by center frequency and bandwidth, relative sensitivity, beam diameter, focal zone, and attenuation effects in water paths and test materials. Pulser/receiver design and setup also have a
major effect on performance, as does cable length. Knowledge of how these factors interact and how they will affect echo response from typical test targets is important for optimizing resolution and sensitivity in very high frequency work. This paper also includes examples of specific test applications utilizing the frequency range from 50 MHz to 225 MHz.
1. Test Material Properties
In any ultrasonic test, it is necessary to consider how the physical properties of the test material will affect sound transmission, and this becomes increasingly important as frequency increases. Attenuation and scattering in the test material are frequently limiting factors in very high frequency testing, typically restricting its use to applications involving relatively thin materials with good sound transmission properties, and making use of very high frequencies impractical in situations involving thick test pieces or materials that exhibit high levels of ultrasonic attenuation or scattering, such as soft polymers and coarse grain cast metals.
The theory of attenuation and scattering is complex and has been described elsewhere in detail.[1] The loss of amplitude due across a given sound path will be the sum of absorption effects, which increase linearly with frequency, and scattering effects, which vary through three zones depending on the ratio of the size of grain boundaries or other scatterers to wavelength. In all cases, scattering effects increase with frequency.[2] For a given material at a given temperature, tested at a given
frequency, there will be a specific attenuation coefficient, commonly expressed in Nepers per centimeter (Np/cm). Once this attenuation coefficient is known, losses across a given sound path may be calculated according to the equation
p = p0℮-αd [3]
where
p = sound pressure at end of path
p0 = sound pressure at beginning of path
℮ = base of natural logarithm
α = attenuation coefficient
d = sound path length
As a practical matter, attenuation coefficients are normally measured rather than calculated. The fact that commercial ultrasonic transducers of frequencies 50 MHz and higher are usually very broad banded makes predicting behavior on the basis of calculations even more challenging, since the different frequency components of the signal are attenuated at different rates. Usually the best way to establish the limits imposed by attenuation and scattering in a specific test situation is by
experimentation.
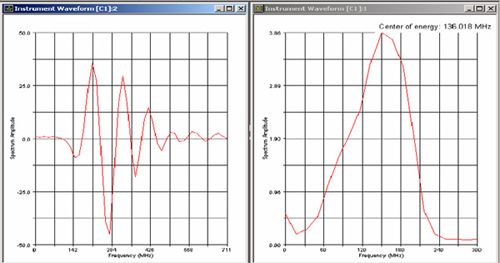
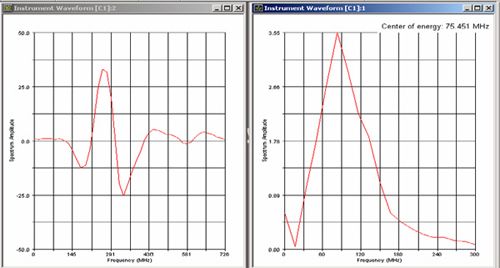
While attenuation effects can be a factor in any ultrasonic test, they can be especially dramatic at high frequencies, and the selection of an optimum test frequency must take this into account. As a practical matter, the maximum test frequency in a given application will always be limited by low pass filtering effects in the test material. In the example below (Figure 1), the waveform and spectrum at left show the echo off the delay line of a high frequency transducer (a Panametrics-NDT V2064)
with a center of energy at 136 MHz. The waveform and spectrum at right show the backwall echo from 0.25 mm of acrylic (with gain increased by 24 dB). The center frequency is now 76 MHz, with higher frequencies having been filtered out by the plastic, and phase distortion is evident as well.
Figure 1. Waveforms showing typical downshifting of 136 MHz signal (top) to 76 MHz (bottom) after traveling through 0.25 mm of acrylic.
2. Water Path Effects
The attenuation effect of water is an additional factor that must be considered in immersion measurements where sound is coupled into a test piece through a water bath or water column. Because the higher frequency components of a broadband pulse will be attenuated more quickly than lower frequency components, long water paths will effectively shift the center frequency of the transducer downward, and this effect will increase as the length of the water path increases. Additionally, this frequency downshift in the received signal will affect the shape of the focal zone, since focused beam diameter and focal zone length from a transducer of a given element diameter and lens design both vary with frequency. This effect can be major if long water paths are used. As a practical matter, at high frequencies water paths must be kept very short in order to avoid significant downshift in the effective test frequency. Note that in water, unlike in typical solids, acoustic attenuation significantly decreases with increasing temperature. Thus the use of warm water (within the specified thermal tolerance limits of transducers) in very high frequency immersion testing will reduce attenuation effects. Attenuation in water drops by approximately 25% between cool water at 15° C and warm water at 25° C. [4]
The downshift in the peak frequency of a broadband pulse traveling through water may be calculated from the following equation:
[5]

where
f0 = unattenuated peak frequency
fpeak = attenuated peak frequency
α = attenuation coefficient in water, 25.3 x 10⁻¹⁷ Neper/cm/Hz2 (typical at 20° C)
Z = total water path length in centimeters
σ = f0(% bandwidth)/236
Table 1 shows the approximate one-way water path lengths (in millimeters) that will produce center frequency downshifts of 5%, 20%, and 50% in the received signal for some common very high frequency immersion transducers. Note that the formula above calculates total (round trip) water path length. For a clearer reference to actual test conditions, these numbers are adjusted to represent the one-way distance between the transducer lens and the surface of the test piece.
Frequency/Bandwidth | Water path length producing indicated frequency shift | ||
| -5% | -20% | -50% | |
| 50 MHz, 80% BW | 1.8 mm | 4.3 mm | 13.2 mm |
| 50 MHz, 100% BW | 1.1 | 2.4 | 4.3 |
| 100 MHz, 80% BW | 0.45 | 1.1 | 1.7 |
| 100 MHz, 100% BW | 0.28 | 0.40 | 1.1 |
| 150 MHz, 80% BW | 0.20 | 0.47 | 0.78 |
| 150 MHz, 100% BW | 0.13 | 0.18 | 0.48 |
3. Transducer Design Considerations
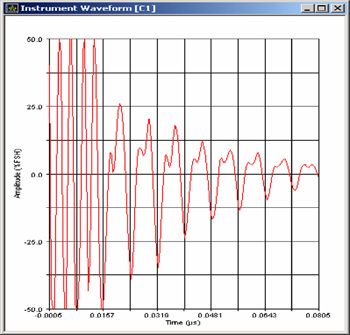
For any ultrasonic transducer used in typical NDT applications, echo recovery time as determined by center frequency and bandwidth determines the minimum measurable thickness or the near surface dead zone (Figure 2). For optimized axial resolution, high frequency applications typically use heavily damped broadband transducers with -6 dB bandwidths in the range from 70% to 110%.
Figure 2. Measurement of 0.025 mm steel with 225 MHz delay line transducer (Panametrics-NDT V2113), scale 10 ns/div, echo recovery time less than 5 nanoseconds
Because piezoceramic elements in this frequency range are extremely thin and delicate, conventional transducers of this type usually employ a construction technique in which the element is bonded to a delay line of fused silica or a similar material, which provides mechanical strength without significant attenuation. This approach may be used for either immersion transducers of delay line contact types. Unfortunately, fused silica is a poor acoustic impedance match to water and other low impedance materials, so significant energy may be reflected from the end of the buffer. Alternately, immersion transducers may utilize very thin films of plated piezopolymer in direct contact with water. Such transducers have the advantage of excellent sound coupling into water, which increases effective sensitivity, but they are very delicate and need to be handled with care to avoid scratching or tearing the polymer film.
As is the case with work at conventional ultrasonic test frequencies, beam focusing is often employed in very high frequency work. Very short focuses are common, both to create a tightly focused beam and to permit use of a short water path. Sharp focuses will optimize lateral resolution in imaging applications, and detection of very small flaws in pulse/echo flaw detection. Focused spot sizes as small as 0.05 mm are readily achievable with commercially available transducers. At the same time, the short depth of field associated with a sharp focus can result in rapid changes in effective sensitivity with depth, especially when working in materials with high sound velocities like ceramics.
The approximate characteristics of a focused beam can be calculated from the equations below, which assume a single frequency rather than a broadband output and thus become somewhat imprecise at broad bandwidths. Note that focal zone characteristics must always be calculated with respect to the sound velocity, focal length, and near field length in the test material, and should be adjusted to reflect any frequency downshifting caused by low pass filtering effects of the sound path.
- 6 dB beam diameter at the focus:
Beam diameter = .2568DSF
where
D= element diameter
SF = focal length/near field length
Height of -6 dB focal zone (distance between the near and far points where the amplitude of an on-axis pulse/echo signal drops to 50% of the peak at the focal point):
Focal zone = (N)( SF2) [2 / 1 + .5 SF)]
where N = near field length
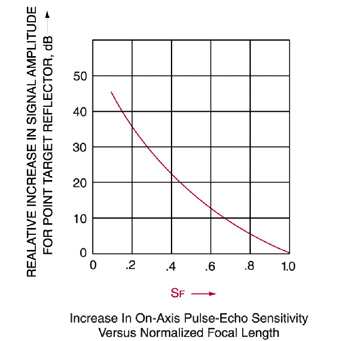
Focusing gain (relative increase in sensitivity at the focal point compared with an unfocused transducer) is based on SF and may be estimated from the following graph (Figure 3):
Figure 3. Focusing Gain
The significant effect of focal spot size can be seen in the C-Scan images below (figure 4), which depict a cluster of nominal 0.25 mm diameter laser-drilled reference holes in aluminum oxide imaged at 0.025 mm scan index. The image at left was made with a 20 MHz, 3 mm element diameter, 19 mm focus (in water) transducer with a theoretical -6 dB focal diameter of approximately 0.5 mm. Because the beam spot size at the focus is larger than the target holes, the image is diffuse. The image at
right was made with a 50 MHz, 6 mm element diameter, 12.5 mm focus (in water) transducer with a theoretical focal diameter of approximately 0.05 mm. With a focal spot size much smaller than the target holes, the image is much sharper.

Left: C-Scan image at 20 MHz with focal spot size approximately 0.5 mm
Right: C-Scan image at 50 MHz with focal spot size approximately 0.05 mm.
4. Transducer Test Considerations
The observed performance of any ultrasonic transducer is affected by factors such as the type and magnitude of the excitation pulse, cable length, and receiver signal processing, in addition to effects introduced by the medium through which the ultrasonic pulse travels and the reflector that creates an echo. All of these factors become especially critical at very high frequencies. Transducer manufacturers will normally specify performance based on the use of specific pulser/receiver instrumentation at specific settings. The use of different instrumentation may have a significant effect on parameters such as bandwidth and recovery time. Additionally, the type of reference target, and in the case of immersion transducers the water path length, will have a significant effect on the received signal. Very high frequency focused immersion transducers will often be tested with an equal phase reflector, a spherical target that conforms to the hemispherical lens to permit use of an extremely short water path (under 1 mm) to minimize water path attenuation effects. Users who require specific transducer performance should discuss these considerations with manufacturers to avoid confusion.
5. Instrumentation Design Considerations
The performance of any ultrasonic transducer will be significantly affected by the type of excitation pulse that is used to drive it, and this is especially true at very high frequencies. Thickness gaging, imaging, and flaw detection at 50 MHz and higher normally employ highly damped broadband transducers that are driven by spike excitation, meaning a single high voltage negative excitation pulse with a very fast rise time and an exponential decay. For optimum frequency response, the rise time
of the excitation pulse must be much shorter than the period of the transducer. Pulsers that are designed for use at high frequencies should be capable of generating an excitation pulse with a minimum rise time on the order of 1 nanosecond.
While ultrasonic transducers at frequencies in the conventional range below 20 MHz can normally handle excitation potentials of several hundred volts with associated energies of hundreds of microjoules, high frequency transducers must be pulsed more gently. At the extreme, the 400 volt excitation pulse delivered by many common lower frequency flaw detectors may cause dielectric breakdown and internal arcing that will destroy very high frequency transducers. At lesser voltages, the transducer
may not be damaged but its waveform will be severely distorted and its bandwidth compromised. While specific limits will vary with transducer type and pulser configuration, a general rule is that spike excitation pulses for 100 MHz transducers should be limited to approximately 4 uJ at 120 volts, and at 200 MHz they should be limited to 2 uJ at 60 volts.
In the example below (Figure 5), a 100 MHz broadband delay line transducer (Panametrics-NDT V2012) has been excited with ~100 volt spike pulses of 1 uJ (left) and 16 uJ (right) energy from a pulser/receiver. With higher energy, the echo amplitude actually decreases because of saturation effects, and the waveform becomes more narrow banded and phase distorted.
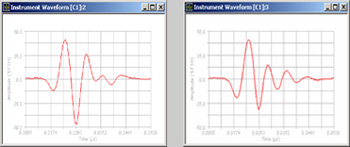
Right: 16 uJ excitation -- distorted response
On the receiver side, RF bandwidth must be sufficient to process received echoes without causing frequency downshift and associated phase distortion. An RF bandwidth of at least twice the center frequency of the received signal is recommended.
High frequency transducers must be used with very short cables between the pulser and the transducer. Because of the inevitable mismatches of electric impedance, a portion of the excitation pulse is reflected back from the transducer, and a portion of that reflection is in turn reflected from the pulser to the transducer as a second excitation pulse. Unless the electrical transit time in the cable is much shorter than the period of the transducer, this cable reflection will re-excite the transducer, causing ringing and distortion that will limit near surface resolution. For optimum response, cables should normally be kept shorter than approximately 600 mm at 50 MHz and 300 mm at 100 MHz. If a test setup requires a longer distance between the transducer and the instrumentation, as in some scanning systems, then a remote pulser/preamplifier should be used to drive the transducer via a short cable and then feed signals to a parent instrument that may be several meters away.
The waveforms in Figure 7 below demonstrate the effects of cable reflection. At left is the waveform from a 100 MHz broadband transducer (Panametrics-NDT V2012) excited through a 300 mm cable. At right, the cable length has been increased to 900 mm. Cable reflections significantly increase the transducer's ringdown time and narrow its bandwidth.
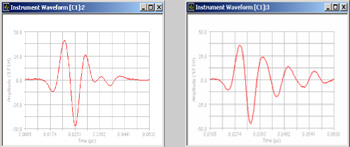
Figure 7. Left: 100 MHz transducer with 300 mm cable (optimum waveform)
Right: 100 MHz transducer with 900 mm cable (increased ringing)
Pulser damping settings will have a major effect on the response of very high frequency transducers. Typically low damping resistance (50 ohms or less) should be used for optimum frequency response. It should also be noted that the electrical impedance of the transducer cable can also have an effect on response. Most standard commercial cables for ultrasonic transducers have nominal 50 ohm electrical impedance. Use of lower impedance cables (typically 25 ohm or 15 ohm) with a given transducer and pulser can result in slightly high center frequency and slightly reduced bandwidth. The advantages or disadvantages of low impedance cables in a given application should be determined experimentally.
6. Practical Uses of Very High Frequency Ultrasonic Testing
The ability of ultrasonic transducers of 50 MHz and higher to focus very sharply and resolve very thin layers of material has led to the development of tests that could not be accomplished at conventional frequencies below 20 MHz. At the same time, the increase in attenuation and scattering effects associated with higher frequencies generally limits the use of such transducers to applications involving thin sections of low attenuation, non-scattering test materials. The most common applications using test frequencies of 50 MHz and higher include the following:
- High resolution ultrasonic imaging of materials like microelectronics components, ceramic parts, and biological tissue. Axial resolution better than 0.025 mm can be achieved in some cases. Resolution will typically decrease with depth.
- Thickness gaging of very thin nonmetallic coatings on nonmetallic substrates, such as paint on plastic, including measurement of individual layers of multilayer coatings. In some cases thicknesses of less than 0.020 mm can be measured.
- Thickness gaging of very small polymer tubing (diameter under 1 mm, wall thickness as low as 0.050 mm), such as medical catheter tubing.
- Very high frequency material analysis.
Notes
[1] Bhatia, A. B., Ultrasonic Absorption: An Introduction to the Theory of Sound Absorption and Dispersion in Gases, Liquids, and Solids (1985), Dover Publications, New York.
[2] Jacobs, Laurence J. and Owino, Joseph O. (2000), "Effect of Aggregate Size on Attenuation of Rayleigh Surface Waves in Cement-Based Materials", J. Engrg. Mech., ASCE 126(11), 1124-1130.
[3] Krautkramer, J. and Krautkramer, H., Ultrasonic Testing of Materials (1990), Springer-Verlag, Berlin Heidelberg New York
[4] Pinkerton, J. M.M. (1949), "The Absorption of Ultrasonic Waves in Liquids and its Relation to Molecular Constitution", Proc. Phys. Soc., B62, 129-147.
[5] American Society for Nondestructive Testing specification E 1065, "Standard Guide for Evaluating Characteristics of Ultrasonic Search Units"
