Multi-mode Adhesive Bond Testing
Introduction
Adhesive-bonded components and structures have become an important part of manufacturing, not only in the aerospace industry but also in the automotive, wood-based panel, and marine industries. The integrity and reliability of bonds are critical to the quality of end products.
The wide range of materials and configurations used in multilayered structures and the need for nondestructive evaluation of bonds has resulted in a great variety of testing equipment and methods. Ultrasonic and acoustic test methods have been quite successful. However, no single inspection method has been found adequate for the wide variety of applications seen today. The Cessna Citation III aircraft, for example, is constructed almost entirely from composites. This single airplane contains many types of bonded material, as shown in Figure 1.
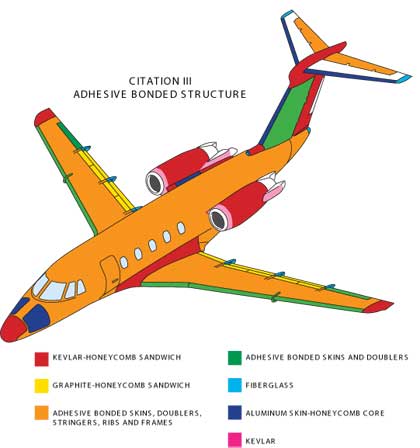
Figure 1. Citation III airplane composition
The advent of advanced microprocessors, memory chips, and software has allowed a number of different acoustic and ultrasonic test methods to be combined in a single, portable instrument. A much greater variety of bonded joints can now be evaluated using only one instrument, which can be switched between several test modes.
The following sections discuss the five major inspection methods used to inspect adhesive-bonded structures. The basic principal behind each method is discussed, as well as its practical application.
The use of a single instrument offering multiple inspection methods allows the inspection of many different composite materials and configurations. Descriptions of the three test modes and five inspection methods are provided using BondMaster 600 instrument screen illustrations from real-life applications.
Applications for the resonance, pitch-catch, and MIA mode are presented, along with notes on their use. Although primarily used for the detection of delaminations and disbonds, these modes can sometimes be used for thickness or defect-depth determination
Inspection Methods
Five inspection methods are available to inspect for defects in the wide range of materials used for adhesive-bonded joints. The optimum method is selected and the instrument is then automatically configured according to the type and frequency of the probe attached to it. The selected method and any related adjustments can be set up in the laboratory and stored in memory for later use in the field.
Pitch-Catch Test Mode - In pitch-catch mode the user can choose from three different inspection methods: the RF method, the impulse method, and the swept method. The setup for this mode is very easy and requires no couplant; one advantage is that the effect of lift-off is distinct from a disbond signal.
Pitch-Catch RF Method - This method employs a dual-element, point-contact, dry-coupled ultrasonic probe. One element transmits (pitches) a burst of acoustic energy into the test part and a separate element receives (catches) the sound propagated across the test piece between the two probe tips. The bond condition beneath the two tips can be determined, but unlike the impulse mode, where the probe signal goes through a detector, the RF mode displays raw RF signals from the probe receiving tip. The difference in the energy amplitude and/or phase between good and bad bonds is detected. The user positions a gate at the optimum point to monitor the response of the received signal that is most affected by the defect. This time-gate position will determine the portion of the signal that is displayed on the flying dot display in RUN modes. The inspection is done at a fixed frequency, which is defined as part of the setup process. | 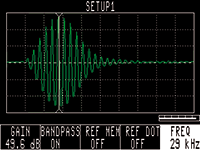 |
Pitch-Catch lmpulse Method - This method employs a dual-element, point-contact, dry-coupled ultrasonic probe. One element transmits (pitches) a burst of acoustic energy into the test part and a separate element receives (catches) the sound propagated across the test piece, between the two probe tips. The bond condition beneath the two probe tips can be determined. With the impulse method, data from the receiving tip is filtered through a detector before being displayed (unlike with the RF method, where the probe signal is displayed as raw RF data). The difference in the amplitude and/or phase between good and bad bond conditions is detected. As with the RF method, the user positions a gate at the optimum time along the signal in order to monitor the response of the received signal that is most affected by the defect. This gate position will determine the portion of the signal that is displayed on the flying dot display in RUN modes. The inspection is done at a fixed frequency, which is defined as part of the setup process. | 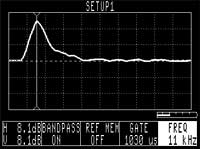 |
Pitch-Catch Swept Method - This method employs a dual-element, point-contact, dry-coupled ultrasonic probe. One element transmits (pitches) a burst of acoustic energy into the test part and a separate element receives (catches) the sound propagated across the test piece between the probe tips. The frequency is swept through a range to obtain a circular display that is larger for disbonded material. The circular display represents the phase and amplitude components of the signal across the sweep of frequencies. One significant advantage is that the effect of lift-off is distinct from a disbond signal. Unlike the RF or impulse method, the frequency is not fixed in swept mode; the inspection is done using the defined frequency sweep and a defined repetition rate. | 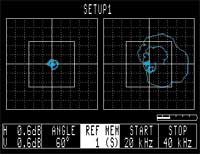 |
MIA Mode - The MIA (mechanical impedance analysis) test method uses a single-tipped, dual-element probe. A drive element generates audible sound waves and a receive element detects the effect of test-piece bond variations on probe loading. During setup, the drive frequency is swept through the range of 2 kHz to 10 kHz to establish the optimum test frequency. Testing is then performed at a fixed frequency. This method does not require couplant and has a small contact area; it can therefore be used on irregular or curved surfaces. It works well on disbonds, crushed core, and defects on the inside of composite structures. It is also applicable for mechanical scanning systems. | 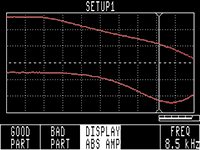 |
Resonance Mode - The ultrasonic contact probe is driven at its resonance frequency and placed on the sample along with couplant. To detect disbonds, electrical impedance changes in the sensor are analyzed. This method works well for many disbonded and delaminated materials. In many cases, the disbond depth can be related to the rotation of the signal phase. This test requires liquid couplant and a variety of probes, which can limit or complicate its application. | 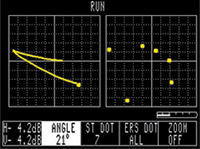 |
The best mode to use for inspecting a particular material and defect type can be set up in the shop or laboratory for later recall in the field. When the operator connects the required probe, the instrument is automatically configured for the appropriate mode. The operator can then choose a setup to recall and calibrates the probe for sensitivity.If a setup has not already been programmed for a specific application, the operator must determine the mode and probe to use; the mode is then automatically set upon connection of the probe. Next, the user selects the parameters required to evaluate the joint, based on specific bond-calibration standards.
The simple pitch-catch mode, which uses no couplant, is generally preferred when applicable.
Many delaminations can be readily detected by resonance testing. This method also detects many types of disbonds. However, with resonance testing, the setup and operation can be more complicated and requires a liquid couplant, making it more difficult to scan the joint. With some composite materials and structures, the use of liquid couplants is not allowed due to possible contamination. The resonance inspection method is particularly good at detecting disbonds or delaminations in thin-skinned composites. More specific information on test modes and frequencies is covered in the following pages of this guide.
Pitch-Catch Mode
The pitch-catch test mode employs a dual-element, point-contact, dry-coupled ultrasonic probe. In this mode, one element transmits (pitches) a burst of acoustic energy into the test part and a separate element receives (catches) the sound propagated across the test piece between the probe tips. The bond condition beneath the two probe tips (elements) will affect the characteristics of the accoustic energy that is transmitted between the two tips (see Figure 2); these characteristics can be displayed in terms of phase and amplitude change.
In a bonded condition, a portion of the acoustic energy is attenuated by the structure below the inspection surface, resulting in a lower signal amplitude being displayed on the instrument. In a disbond condition, the waves travel between the transmit (pitch) element and the receive (catch) element with very little attenuation or damping from the bonded structure. The result is that a higher signal amplitude is displayed. A bandpass from 0 kHz to 35 kHz can be selected, for each pitch-catch method, to help the user filter undesirable noise generated by probe movement.
Pitch-Catch RF Method
With the pitch-catch RF method, the received signal bypasses an amplitude or phase-amplitude detector. The frequency is chosen that provides maximum flexural motion for the layer thickness and the material being tested. A variable time gate is used to select the received pulse cycle having the greatest change in amplitude when the probe is moved from a bonded area to a disbonded area. The amplitude will be larger over the disbonding, as the motion of the plate or layer is restricted over a bonded joint, and energy is lost into the base material of the joint.
A separate receive element, a set distance from the transmit element, picks up the waves propagated across the part, as shown in Figure 2 (on previous page). The energy is carried in a plate-wave mode across the test piece between the two probe tips. The return signals are detected and a phase-amplitude display is used to show the effect of good and bad bonds on the sound path.
For the pitch-catch RF method, the alarm can be set either for an amplitude-only display or for a phase-and-amplitude display as shown in Figure 3 and Figure 4. In addition, these two displays can be combined on one screen using the RUN2 mode shown in Figure 5.
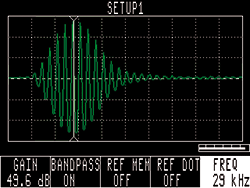
Figure 3. RF method time-base display
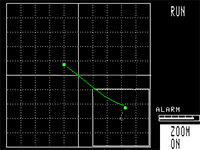
Figure 4. RF method phase-amplitude display
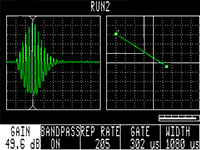
Figure 5. RUN2 mode
Pitch-Catch Impulse Method
This method is similar to the previously noted RF method except that it uses a short, single-frequency burst.
The frequency is chosen that provides a maximum flexural motion for the layer thickness and material being tested. A variable time gate is used to select the received pulse having the greatest change in amplitude when the probe is scanned from a bonded area to a disbonded area.
The amplitude will be larger over any disbonding, as the motion of the plate or layer is restricted over a bonded joint and energy is lost into the joint's base material.
Normally, the frequency and gain are adjusted over a disbond to obtain a maximum signal. Then, the signal from the disbond is compared with a signal from a bonded joint. Where the signal over the well-bonded area is significantly lesser, the gate is set to the signal delay time. This time vs. amplitude can be displayed, and the alarm can be set at the selected amplitude.
For the pitch-catch impulse method, the alarm can be set either for an amplitude-only display or for a phase-and-amplitude display as shown in Figure 6 and Figure 7. In addition, these two displays can be combined on one screen using the RUN2 mode shown in Figure 8.
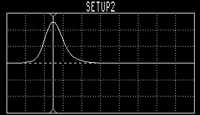
Figure 6. Impulse method time-base display
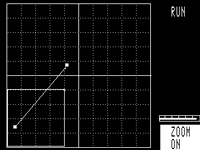
Figure 7. Impulse method phase-amplitude display
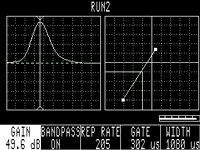
Figure 8. RUN 2 mode
Pitch-Catch Swept Method
The pitch-catch swept method uses frequencies from 5 kHz to 100 kHz to activate the transmit element. The energy is carried in a plate-wave mode across the test piece between the two probe tips. The return signals are detected and a phase-amplitude display is used to show the effect of good and bad bonds on the sound path. The swept frequency provides a circular pattern with some minor resonance loops, as shown in Figure 9.
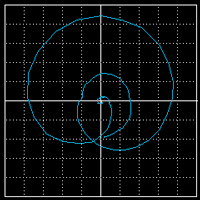
Figure 9. Pitch-catch signal display
Because the plate (Lamb) waves are attenuated by coupling into the second layer in well-bonded joints, these signals are small. In a disbond region, the waves travel in the plate with very little attenuation or leakage into the backing material, and a much larger signal pattern is displayed.
Investigation has shown that the primary mode of wave propagation in the layer is by the 1st asymmetrical Lamb wave mode, which vibrates as shown in Figure 10.
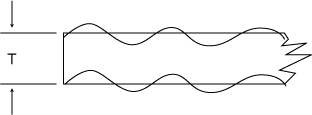
Figure 10. 1st asymmetrical Lamb wave (flexural plate wave) mode
Other, lesser-energy modes may account for some of the minor loops sometimes observed, or they could be due to boundary effects. No definite correlation between these minor loops and bonding or disbonding size have been observed.
The propagation speed or phase velocity of Lamb waves are a function of the frequency and layer thickness for a particular plate material. These dispersion curves are shown in Figure 11.
Figure 11. Lamb-wave modes in an aluminum plate
For the low frequencies and layer thicknesses normally encountered in bond testing, the region of interest is at the leftmost end of the 1st asymmetrical mode, where there is the maximum slope. If this region is expanded for an aluminum skin, it appears as shown in Figure 12.
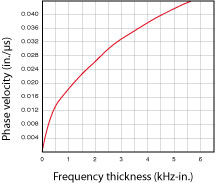
Figure 12. Normal test region (1st asymmetrical mode)
For example: f = 50 kHz, t = 0.020 in.; then f•t = 1.0, v = 0.019 in./µs, and l = 0.38 in.,
where f = frequency, t = layer thickness, v = phase velocity, and l = wavelength.
The setup for this method is very easy, and requires no couplant. The probe has only to be placed on a good or bad bond, and the gain adjusted to provide a signal from a disbond outside the alarm box, as shown in Figure 13a. The signal from the good bond will appear much smaller, as shown in Figure 13b. Poor contact between the probe and test piece results in a decrease in the amplitude or in the size of the circular pattern, as shown in Figure 13c. A disbond signal has the opposite effect, which allows false readings to be greatly reduced. Because of the low frequencies used, this test method is best at detecting near-surface disbonds, as well as deeper defects.
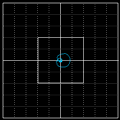
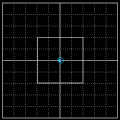
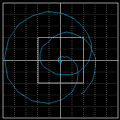
Figure 13a. Pitch-catch swept signal patterns for disbond.
Figure 13b. Pitch-catch swept signal patterns for a good bond.
Figure 13c. Pitch-catch swept signal patterns for poor contact.
With the special menu; the user can choose to drive the swept mode using a low-, medium-, or high-repetition rate, making this method a very fast way to inspect.
MIA Mode
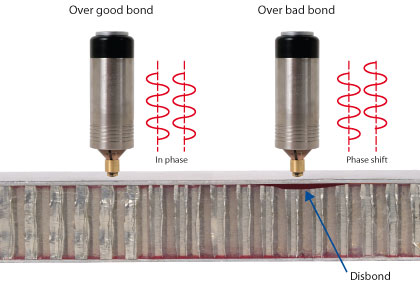
The mechanical impedance analysis (MIA) inspection method uses a single-tipped, dual-element probe. A drive element, coupled to the test piece through a plastic cone and wear shoe, generates audible sound waves into the test part. A drawing of an MIA probe inspection method is shown in Figure 14. The probe assembly is shown in Figure 15.
Figure 14. MIA inspection method
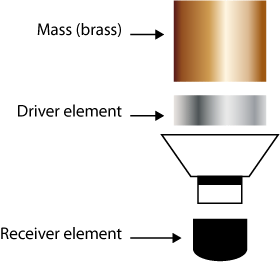
Figure 15. MIA probe assembly
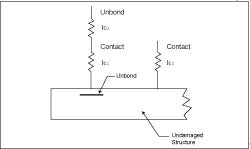
Figure 16. Spring model
The loading of the receive element at the bottom of the cone is affected by the stiffness of the sample, which changes from very high to low, from bonded to disbonded regions. The spring model developed by P. Cawley (see Figure 16) describes the impedance as measured at the top of the spring., The spring stiffness over a disbond is the contact stiffness of the probe in relation to the defect stiffness. Over a well-bonded composite, the spring stiffness is only the contact stiffness. Since the measurements comprise a comparison of stiffness, results are better over stiff structures, because more flexible composite structures have less change from bond to disbond. The defect stiffness is dependent on the size and thickness of the disbond. As the impedance varies with the frequency, the proper test frequency is critical to obtaining good results.
The loading of the receive element affects the signal amplitude and phase. The change in amplitude and/or phase can be an increase or a decrease when the frequency is near or above the resonance frequency of the layer. During setup, the drive frequency is swept through the range of 2 kHz to 10 kHz to determine the frequency for the test. The operator selects the frequency having the greatest difference in phase or amplitude between the good and bad bonding. Testing is then performed at this
fixed frequency. Figure 17 shows the frequency sweep display and Figure 18 shows a typical fixed-frequency amplitude display.

Figure 17. Frequency-sweep display.
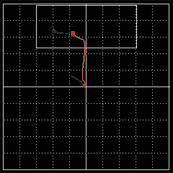
Figure 18. Typical fixed-frequency amplitude display
The MIA mode does not require a couplant. Because a small contact area is involved, it can be used on irregular or curved surfaces. It works well on disbonds, crushed core, and bond defects on the inside wall of a composite structure. This method is applicable for continuous or mechanical scanning using either spring loading or constant pressure on the probe tip.
Defect samples made from Teflon® inserts may not be readily detected by the MIA method as the inserts stiffen the simulated disbond and thus greatly reduce sensitivity to this type of defect. Actual disbond defects are readily detectable.
Resonance Mode
The resonance method uses special narrow-bandwidth ultrasonic contact probes. The method is based on the change in impedance of the sharply resonant high-Q ultrasonic transducer when acoustically coupled to a material. The measured electrical impedance of the transducer is affected by the acoustic impedance of the test sample. The acoustic impedance in a specific composite is altered by any lack of bonding.
A disbond acts as a thin plate that vibrates, generating a standing wave when the thickness is equal to odd number multiples (1, 3, 5, etc.) of the length of the acoustic wave in the plate.
For one wavelength: l = v/f, where v = sound velocity in the material and f is the resonance frequency. The thinner the layer, the higher the resonance frequency.
Figure 19 shows a resonance transducer coupled to a test piece at a disbonded joint, and the resultant standing wave.
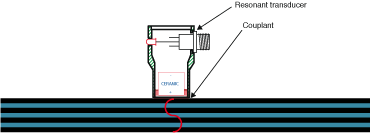
Figure 19. Resonant standing wave in a thin plate or disbonded joint
For the acoustic impedance: Z = rVtanh[a +i(ß +kt)], where a is the reflectivity constant, ß is the phase change, t is the plate thickness, and k is the wave number.
In an adhesive-bonded joint, changes in the effective thickness caused by disbonding significantly affects the phase and amplitude of the signal at the resonance frequency of the transducer. In a multilayered joint, the phase is related to the depth of the disbonded layer, as shown in Figure 20.
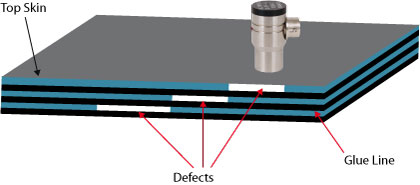
Figure 20. Multilayer disbond test
The instrument automatically selects the resonance frequency of the transducer in air by sweeping over a frequency range and locating the phase null.
The instrument then operates at that frequency in the RUN modes. Figure 21 illustrates correct operation of the probe.

Figure 21. The instrument sweeps through the frequency range of a probe and displays the probe's resonance characteristics. Confirmation of the resonance frequency confirms the correct operation of the probe.
Coupling the probe to a composite part causes the part to act as a damping member, reducing the amplitude and increasing the bandwidth of the transducer as well as changing the resonance frequency. By nulling out the good bond signal, the phase- and amplitude-vector end points of a disbond are compared to a good bond on a polar-coordinate display. The phase is indicated by the rotation of the spot and the amplitude by the distance from the center null point. The signals on the display will
appear as shown in Figure 22.
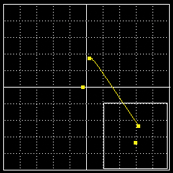
Figure 22.
The frequency of the probe is chosen based on skin-layer thickness and material type. For optimal sensitivity to disbonds, the thinner the layer is, the higher the probe frequency should be.
The frequency of the probe should be proportional to the acoustic impedance of the layer. Materials such as graphite or fiberglass, with low impedance (Z = rV, where Z is the impedance, r is the density and V is the velocity of sound waves in the material), require lower-frequency probes than metal-skin layers. Frequencies in the range of 35 kHz to 500 kHz have been useful for most bond testing, with the higher frequencies used for thinner or metallic layers.
References
1. Teller, C., Dierks, K., Bar-Cohen, Y., and Shaw, N., 'Nondestructive Evaluation of Adhesive Bonds', 16th Symposium on Nondestructive Evaluation, San Antonio, Texas, April 21-23, 1987.
2. Lamb, H. 'On Waves in an Elastic Plate' Proceedings of the Royal Society of London, Series A, Vol. 93, (1917), pp 114-118.
3. Worlton, D.C. 'Experimental Confirmation of Lamb Waves at Megacycle Frequencies', Journal of Applied Physics, Vol. 32, (1961), pp 967-971.
4. Viktorov, I. A. 'Rayleigh and Lamb Waves', Plenum Press, New York (1967), pp 67-117.
5. Fitch, C. E. Jr., 'Pulsed Low Frequency Ultrasonic Bond and Thickness Testing', Air Transport Association NDT Forum, 1991.
6. Cawley, P. 'The lmpedance Method of Nondestructive Inspection' NDT International, Vol. 17, (1984) pp 59-65.
7. Cawley, P. 'The Sensitivity of the Mechanical lmpedance Method of Nondestructive Testing', NDT International, Vol. 20, pp 209-21 5.


