Executive Summary
Previous use-wear studies involving quartz and quartzite have been undertaken by archaeologists, but they are comparatively few in number. Moreover, there has been relatively little effort to quantify use-wear on stone tools made from quartzite. The purpose of this case study was to determine the effectiveness of a measurement system—laser scanning confocal microscopy (LSCM)—to document the surface roughness of experimental Mistassini quartzite scrapers used on two different contact materials (fresh and dry deer hide). The laser scanning confocal microscope used was the OLYMPUS LEXT OLS4100.
Mistassini quartzite is typically identified as a relatively fine-grained opaque white or very light gray stone with occasional dark gray to black streaks. Mistassini quartzite is most often associated with a geological formation known as the Colline Blanche located along the Temiscamie River in south-central Quebec.
As in previous studies using LSCM on chert, flint, and obsidian, this study incorporated a mathematical algorithm that permitted the discrimination of surface roughness based on comparisons at multiple scales. This case study specifically employed measures of relative area (RelA) coupled with the F-test to discriminate used from unused stone tool surfaces, as well as surfaces of quartzite scrapers used on dry and fresh deer hide. Results further demonstrated the effect of raw material variation on use-wear formation and its documentation using LSCM and RelA.
The area-scale fractal analysis algorithm RelA for surface characterization was utilized in this case study, such that RelA is the ratio of the calculated area (CA) of the measured surface divided by the nominal area (NA) of that surface (ASME, 2002). RelA was then compared statistically using the F-test (Lipson and Seth, 1973). The F-test compares the variation within each data set to the variations between the data sets to test the significance of these variations.
Methodology
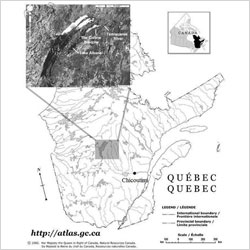 Figure 1: Map of the source location of Mistassini quartzite in the Colline Blanche formation, central Quebec, Canada. | The four scrapers analyzed in this case study were originally manufactured and used as part of an earlier study on the prehistoric use of Mistassini quartzite in southern Quebec, Canada (Fig. 1). This previous study was part of a larger initiative focused on exploring and clarifying the role of raw material variability in use-wear formation and its implications for reliably interpreting traces of past human behavior. |
Two of the quartzite scrapers used in this case study were made from one Mistassini quartzite core (Core A), while the other two were made from a second core (Core B) (Fig. 2). Core A possesses a coarser-grained crystalline structure than Core B despite procurement from the same outcrop, thus representing the kind of intrasource variation noted above. One scraper produced from each of the two cores was used on either dry hide (DH1, DH2) or fresh hide (FH1, FH2) (Table 1). The scrapers were initially manufactured through straightforward hard hammer reduction using stone percussors and were unifacially retouched on the distal end to conform to the standard pattern of scraper production at the Chicoutimi site, the archaeological focus of the earlier case study. The scrapers’ distal edge angles ranged from approximately 78°–84°.

Figure 2 : Coarser-grained Mistassini quartzite (left) and finer-grained Mistas¬sini quartzite (right).
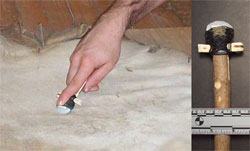 Figure 3 : Hafted quartzite scraper (DH1) used to scrape dry deer hide mounted on a plywood board. | The four distally retouched flakes were hafted in straight wooden handles 15 to 18cm in length. The handles were slotted at one end and a second smaller piece of wood was fitted perpendicularly to the length of the handle at the base of the slot to aid in securing the scraper in its haft. Woodworking adhesive was used to hold the handle, the smaller piece of wood, and the scraper together, and coated linen thread commonly employed in leatherworking was used to externally bind and further immobilize each scraper in its handle. Both the fresh and dry deer hides were extended across sheets of plywood and nailed down to restrict their movement during use. The mounted dry hide was scraped on a laboratory floor and the mounted fresh hide was scraped on a wet lab table to contain the removed fat and soft tissue (Fig. 3). |
Experimental Mistassini Quartzite Scrapers
| Core no. | Tool no. | Distal edge angle (mean) | Contact material | Length of use | Used/unused region no. | No. of area scans |
| Core A | DH2 | 84° | Dry deer hide | 120 min | UDH2/NDH2 | 6/6 |
| FH1 | 78° | Fresh deer hide | 120 min | UFH1/NFH1 | 6/6 | |
| Core B | DH1 | 80° | Dry deer hide | 120 min | UDH1/NDH1 | 6/6 |
| FH2 | 81° | Fresh deer hide | 120 min | UFH2/NFH2 | 6/6 |
Table 1: One scraper produced from each of the two cores was used on either dry hide (DH1, DH2) or fresh hide (FH1, FH2).
The hide scraping was performed in as controlled a manner as possible. Each tool-user leaned over a given scraper to apply a similar load on each tool. Each user also maintained a constant implement-to-working-surface angle and stroke rate in order to maximize consistency of tool use activity. Despite the fact that hide-working can involve several different use-motions, the original experiment was limited to transverse unidirectional motions (i.e., movement perpendicular to the utilized edge), in which the tool edge was drawn toward the tool-user in a consistent one-stroke movement at a working angle of 45°. The edge was then picked up after covering a distance of roughly 15cm with each stroke and the motion was repeated until the experiment time elapsed (Fig. 4).

Figure 4 : Schematic diagram of the setup used for experimental use of the quartzite scrapers.
Based on a constant rate of tool use, each tool was used at a rate of one stroke per second, a total of 7200 strokes after 120 minutes of use. While it would have been possible to control more experimental variables by implementing a mechanical system to replicate scraping, it was decided to retain the human element in order to maximize the interpretive value for subsequent comparisons to archaeologically recovered specimens. Because ethnoarchaeological research suggests scraping hides on ground surfaces or mounted in wooden frames may replicate past activity more accurately (Beyries and Rots, 2008), future experiments using quartzite scrapers may incorporate these components into the hide-scraping process in order to produce a more authentic comparative use-wear sample.
The replicated scrapers were measured with an OLYMPUS LEXT OLS4100 laser scanning confocal microscope following 120 minutes of use for each tool. After each stage of the initial scraping experiments, all tools were subjected to a multistage cleaning regimen to allow for accurate and reliable analyses of wear accrual patterns. This process began with washing each tool in a mixture of warm water and mild detergent to remove all visible residues and debris. This was followed by the manual cleaning of each tool with a 30% sodium hydroxide (NaOH) solution. Lastly, each tool was rinsed with distilled water to remove any contamination associated with previous handling of the implements.
Prior to measurement using the LEXT OLS4100, the quartzite scrapers were removed from their handles and rewashed in warm water with a mild grit-free detergent, and subsequently rinsed and left to air dry. The four tools were examined at 200x magnification under incident light using a Stemp Unitron MS-2BD metallographic microscope to ensure adequate cleaning and to preliminarily identify the regions to be scanned (Fig. 5). To ensure accurate documentation of the experimental use of the scrapers, each tool was bagged separately and all pertinent information was recorded, including activity type, use duration, stroke count, and a plan-view diagram of the tool indicating the portion of the edge that was used (in order to initially position the tool on the motorized stage of the OLS4100 to locate the worn regions).
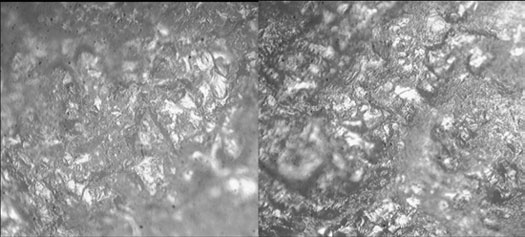
Figure 5 : Photomicrographs of the surfaces of scrapers used on fresh hide (UFH1) (left) and dry hide (UDH1) (right) at 200x magnification. The fresh hide polish appears bright and “liquid-looking” on the higher microtopography of the crystal surfaces with minimal reticular polishing of the lower microto-pography. The dry hide polish is both matte and pitted in appearance, with a much more reticular distribution on the lower microtopography; the higher microtopography has bright and
flat polish zones on the crystal surfaces and lacks the “liquid” or “greasy” look of fresh hide polish. The width of each photomicrograph is approximately 400 μm.
The measurement system employed for the experiments in this exploratory case study was the OLYMPUS LEXT OLS4100 laser scanning confocal microscope. Like similar technology, including AFM and infinite focus microscopy, laser scanning confocal microscopy (LSCM) allows for the visual observation of the actual stone tool surface much like metallurgical microscopes (Keeley, 1980; Vaughan, 1985) and produces a three-dimensional (3D) scanned image of the observed surface based on the mathematical documentation of the varied elevations of the surface on a microscale (Fig. 6).
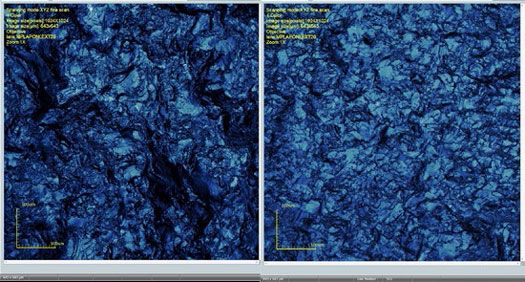
Figure 6: LEXT OLS4100 screen shots of area scans (20x objective) of the surfaces of scrapers used on fresh hide (UFH1) (left) and dry hide (UDH1) (right). The x- and y-axis dimensions are 643 x 643 μm2 (1024 x 1024 pixels).
To measure a surface, a laser scanning confocal microscope creates images using reflected laser light from a discrete focal plane. Only the laser light reflected back from the measured surface from the focal plane through a pinhole aperture located in front of a photomultiplier is used to record topographical structure. Both the diameter of the pinhole aperture and the wavelength of the incident light reflected back from the measured surface determine the depth of each focal slice used to record elevation (Sheppard and Shotton, 1997). The LEXT OLS4100 produces the incident light using a 405nm laser that is scanned across the measured surface by way of a micro-electromechanical resonant galvano mirror. To produce slices of measured sections of the surface, the objective lens on a motorized head focuses the laser onto surface points of variable vertical distance. These slices are used to mathematically create a 3D digitized map of the scanned surface. The OLS4100 used in this work has a vertical scale (z-axis) resolution of 0.8nm and a height display resolution of 1.0nm. It includes a range of objectives from 20x to 100x, of which the 20x objective (0.60 NA) was used for this experimental surface documentation. The number of vertical slices the laser takes of the surface varies depending on the peak-to-valley distance on the surface, the objective used, and the pitch setting, which was set at 0.06 (“fine” pitch) for the measurement of the quartzite scraper surfaces.
Surface Roughness and Relative Area (RelA)
There are a number of fractal analysis programs available. For this case study, the area-scale fractal analysis algorithm RelA for surface characterization was chosen. The effectiveness of this algorithm is based on its calculation of surface roughness at multiple scales that is dependent upon both the order and spacing of a surface’s micro-topographical features, such that RelA is the ratio of the calculated area (CA) of the measured surface divided by the nominal area (NA) of that
surface (ASME, 2002).
RelA(s) = CA(s) / NA(s)
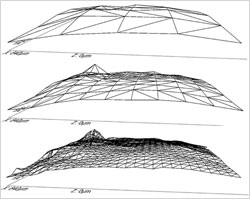 Figure 7: Area-scale analysis using tilings shown on three identical simulated surfaces. The surface areas are covered by 32 (top), 162 (middle), and 1355 (bottom) tiles giving calculated areas (CAs) of 12 μm2, 109 μm2, 2450 μm2, and 282 μm2, and relative areas (RelAs) of 1.0002, 1.0004, and 1.000756. | This algorithm calculates the change in apparent, or calculated, area with respect to the scales of observation, or calculation, by a series of virtual tilings, as demonstrated in Figure 7. The CA(s) is the number of tiles used in a tiling exercise at a particular scale(s) multiplied by the area of the tiles used in that tiling exercise (i.e., that particular area scale, s). The NA(s) is the projected, or nominal, or x times y area, that is tiled in that particular scale(s). The NA varies slightly with each tiling exercise because only full tiles are used, all with the same area(s) in a particular tiling exercise. |
Area-scale measurements such as RelA can be compared statistically at each scale using the F-test (Lipson and Seth, 1973) to determine confidence levels for the discrimination of different surfaces based on the standard deviations of the two surface data sets. The variance demonstrated by these data is the sum of the variances of each of the independent sources. The F-test compares the variation within each data set to the variations between the data sets to test the significance of each of the variations.
The MSR of the measured data is used to determine whether the observed variation is statistically significant and to what level of confidence.
Surface Scans Using LSCM
After cleaning, each of the quartzite scrapers was separately placed on the motorized stage of the OLS4100 for surface measurement. In each used and unused region of each scraper, six different area scans (643 μm2) were taken for a total of 48 area scans, 12 for each tool. To properly quantify changes in surface roughness, each of the area scan locations measured on each quartzite scraper was calculated in terms of RelA on a log scale. For this data, Sfrax was used to process the data. Prior to calculating RelA, the surface scan data was leveled using Sfrax and was also passed through the slope filter set to 80°. RelAs were compared using the F-test to determine whether discrimination of surface roughness was possible. In these experiments, the scales at which there is a high level of confidence (above 95%), as indicated by the MSR, are the scales at which the tools can be discriminated based on measures of RelA.
Experimental Results
This exploratory case study has provided a number of interesting results in terms of the ability to discriminate use-wear on quartzite scrapers and the role of lithic raw material in the wear formation process. First and foremost, these results indicate that laser scanning confocal microscopy is well-suited to document surface roughness on quartzite tools. When coupled with Sfrax software, the data from the quartzite surface area scans demonstrates that the RelAs for both used and unused surfaces for all regions increase as the scale of calculation decreases, as demonstrated for the second scraper (FH2) used on fresh hide (Fig. 8). At the longest scales, the RelAs are close to one, indicating that the scale of calculation is larger than the texture features. As the scale decreases, the RelAs deviate significantly from one. This transition is known as the smooth-rough crossover (ASME, 2002), which has also been noted in the documentation of surface roughness or texture on experimental tools made from flint and obsidian (Stemp et al., 2009, 2010; Stemp and Chung, 2011).
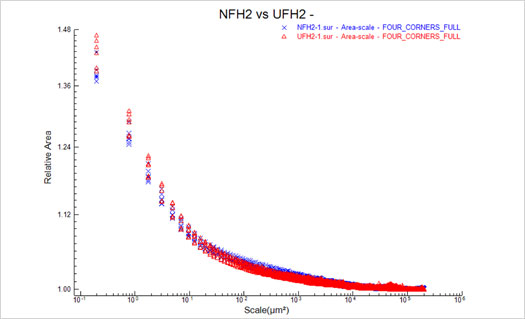
Figure 8 : The relative areas vs. scale for the six area scans in the used (Δ = UFH2) regions and the six area scans in the unused regions (x = NFH2) of the quartzite scraper (FH2) used on fresh hide.
The measures of RelA can be used to discriminate used from unused surfaces on the same tool, but a better indicator of discrimination incorporates the mean square ratios (MSRs) of these RelAs. This algorithm demonstrates that discrimination of the used from unused regions is possible above the 95% confidence level for each of the four scrapers, but that the scales over which discrimination is possible vary by tool. For example, discrimination of the used versus unused regions on scraper FH2 is possible at fine and coarse scales using the F-test (Fig. 9), whereas, for scraper DH2, this is only possible at fine scales (Fig. 10). The measures of the MSRs versus scale are distinctly different for each scraper. Discrimination of used versus unused surfaces is based on the premise that the unworn regions of each scraper are representative of the original surface roughness or texture of the quartzite and that surface roughness in the worn regions of each tool was mathematically similar prior to their use. Therefore, surface roughness differences documented in the two different regions are due to wear accrual through contact with hide on the used part of the scraper.
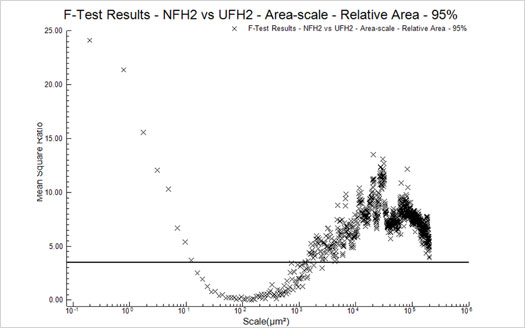
Figure 9: The MSRs for the relative areas of the unused vs. used regions of a scraper (FH2) used on fresh hide. The horizontal line indicates 95% confidence level for discrimination.
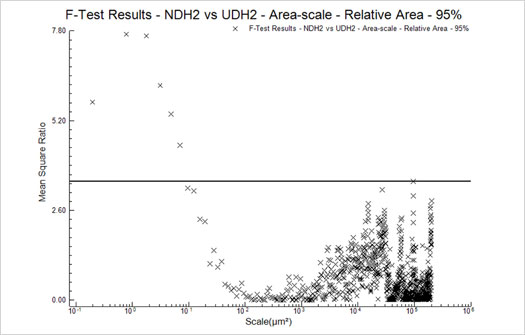
Figure 10 : The MSRs for the relative areas of the unused vs. used regions of a scraper (DH2) used on dry hide. The horizontal line indicates 95% confidence level for discrimination.
The mean RelAs of the six area scans from the used regions of each of the four quartzite scrapers further demonstrate that discrimination is possible and becomes increasingly distinct as scale of measurement decreases. At the finest scales (10−1 μm2), surface roughness can be discriminated with measurable differences between those used on dry hide versus those used on fresh hide, as well as for each of the two tools used on the same contact material (Fig. 11). When the MSRs for the used surfaces of the two tools used to scrape fresh hide are compared to those of the two dry hide scrapers, the RelAs (Fig. 12) are capable of discriminating surface roughness above the 95% confidence level at multiple scales, specifically at fine scales beginning at 102 μm2 and also at coarse scales around 105 μm2. This data suggests that surface roughness that is the result of wear produced by tools used on different contact materials can be objectively quantified and discriminated.
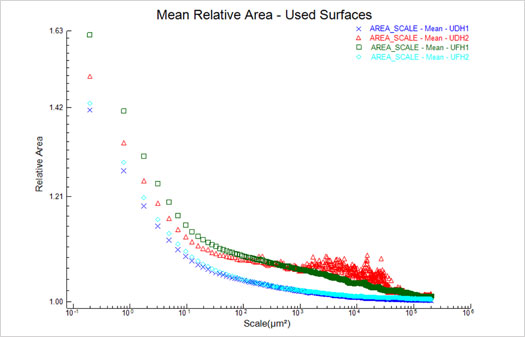
Figure 11 : The mean relative areas vs. scale for the six area scans in the used regions of the two scrapers used on dry hide (x = UDH1, Δ = UDH2) and the two scrapers used on fresh hide (☐ = UFH1, ◊ = UFH2).
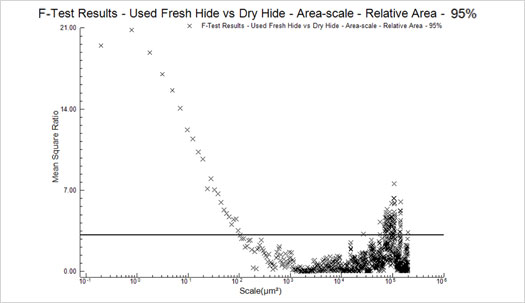
Figure 12 : The MSRs for the relative areas of the two scrapers used on fresh hide (UFH1, UFH2) vs. the two scrapers used on dry hide (UDH1, UDH2). The horizontal line indicates 95% confidence level for discrimination.
If the MSRs for the comparisons of the worn regions of the scrapers used on different contact materials are considered in terms of the cores from which they were produced, differences can be observed between the tools made from finer-grained and coarser-grained quartzites. Whereas the scrapers made from finer-grained quartzite (UDH1 and UFH2) can be distinguished above the 95% confidence level at scales of roughly 101–100 μm2 with MSRs in the 3.50- 5.00 range (Fig. 13), the scrapers made from coarser-grained material (UFH1 and UDH2) are discriminated at scales of about 102–10−1 μm2 with a much different MSR range (Fig. 14). Since all four scrapers were used for the same length of time, these preliminary results suggest that the differences in the structure of the raw materials themselves affect wear formation and the consequent surface roughnesses documented using the LEXT OLS4100.

Figure 13 : The MSRs for the relative areas of the used region of the quartzite scraper (UDH1) used on dry hide vs. the used regions of the scraper (UFH2) used on fresh hide. The horizontal line indicates 95% confidence level for discrimination.
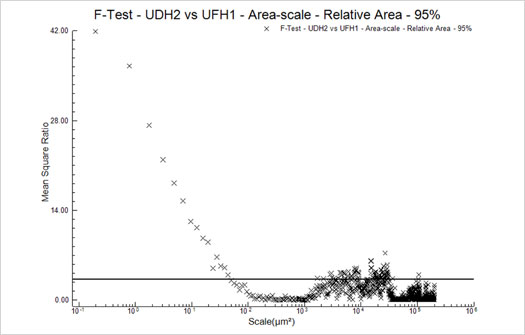
Figure 14 : The MSRs for the relative areas of the used region of the quartzite scraper (UDH2) used on dry hide vs. the used regions of the scraper (UFH1) used on fresh hide. The horizontal line indicates 95% confidence level for discrimination.
Conclusion
The results of this case study demonstrate the effectiveness of laser scanning confocal microscopy (LSCM) and relative area (RelA) for the documentation and discrimination of surface roughness on experimental stone tools made from Mistassini quartzite. Similar to the results of previous work using this technique on obsidian (Stemp and Chung, 2011), LSCM provides an objective way to reliably measure worn and unworn surfaces on another type of silicate stone. When coupled with appropriate
software, surface roughness data can be compared at multiple scales of measurement such that discrimination of used and unused regions on quartzite scrapers is possible. In this case, a scale-sensitive algorithm, not only provided a mathematical characterization of surface roughness over multiple scales, but allowed for direct comparisons of different quartzite surface microstructures such that statistically significant discrimination using the F-test was possible. Specifically, these
experimental results demonstrated that:
1. The RelAs, as calculated by area-scale fractal analysis, are well-behaved with respect to the evaluation area (i.e., sample size)
2. RelAs are capable of discriminating the tools’ used regions at finer scales, whereas unused regions that represent the unmodified fractured surface micro-topography of the quartzite scrapers can be discriminated at medium-to-coarser scale ranges
3. RelAs are capable of effectively discriminating the worn surfaces of the quartzite scrapers used on fresh hide from those used on dry hide in this preliminary study
4. The quartzite scrapers used on the two different contact materials (dry and fresh hide) demonstrated the greatest discrimination based on RelAs at the finer area scales, with the most significant mathematical discrimination occurring between 102 and 10−1 μm2 based on the MSRs
The fact that LSCM coupled with RelA can effectively document and discriminate wear on these experimental tools offers archaeologists another method to study the past uses of chipped quartzite artifacts. Although we anticipate further testing of this method on additional experimental tools made from quartzite, our preliminary experiments provided encouraging results that will enable future work that focuses on the quantification of lithic use-wear. As more tests are performed, specifically on
different contact materials, we will develop a better sense of use-wear accrual and use-wear characteristics in relation to the quantification of worn quartzite tool surfaces.
Acknowledgements
The authors would like to thank a number of individuals for their assistance in this research: Dr. Michael Bisson, McGill University, Canada; Patrick Eid, a graduate student at Université de Montréal, Canada; Vincent Rousseau, an undergraduate (now graduate) student at Université Laval, Canada; and students from Worcester Polytechnic Institute, Massachusetts. We extend special thanks to Dr. Christopher A. Brown, Director of the Surface Metrology Lab, Mechanical Engineering Department, Worcester Polytechnic Institute, for use of the OLYMPUS LEXT OLS4100 laser scanning confocal microscope, and Surfract for use of Sfrax software for calculation of RelA and the F-tests.
References
ASME B46.1. 2002. Surface texture (surface roughness, waviness, and lay): an American National Standard. New York: American Society of Mechanical Engineers.
Beyries S, Rots V. 2008. The contribution of ethnoarchaeological macro- and microscopic wear traces to the understanding of archaeological hide-working processes. In: Longo L, Skakun N, editors. ‘Prehistoric technology’ 40 years later: functional studies and the Russian legacy. Oxford: BAR International Series 1783. p 21–28.
Keeley LH. 1980. Experimental determination of stone tool uses: a microwear analysis. Chicago: University of Chicago Press.
Lipson C, Seth NJ. 1973. Statistical design and analysis of engineering experiments. New York: McGraw-Hill.
Sheppard CJR, Shotton DM. 1997. Confocal laser scanning microscopy. Oxford: BIOS Scientific Publishers.
Stemp WJ, Childs BE, Vionnet S. 2010. Laser profilometry and length-scale analysis of stone tools: second series experiment results. Scanning 32:233–243.
Stemp WJ, Childs BE, Vionnet S, Brown CA. 2009. Quantification and discrimination of lithic use-wear: surface profile measurements and length-scale fractal analysis. Archaeometry 51:366–382.
Stemp WJ, Chung S. 2011. Discrimination of surface wear on obsidian tools using LSCM and RelA: pilot study results. Scanning 33:279–293.
Vaughan PC. 1985. Use-wear analysis of flaked stone tools. Tucson: University of Arizona Press.
W. James Stemp
Surface Metrology and Archaeological Research Technologies Project
Department Of Sociology/Anthropology
Keene State College
Keene, New Hampshire
Harry J. Lerner
Postdoctoral Research Fellow
Faculté des Lettres, CELAT
Université Laval, Québec City, Québec, Canada
Elaine H. Kristant
Surface Metrology Lab, Mechanical Engineering Department
Worcester Polytechnic Institute
Worcester, Massachusetts

