Frequently Asked Questions about TFM
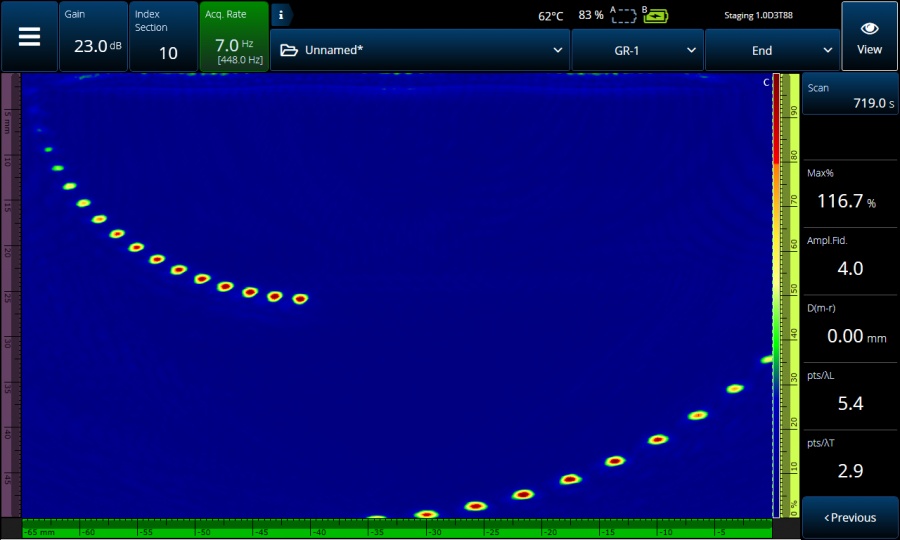
Q: What is TFM, and how does it relate to FMC?
A: The total focusing method (TFM) is based on the same steering and focusing approach of conventional phased array (PAUT), only in this case, the focalization is applied everywhere in the region of interest (the “TFM zone”), not only at a fixed depth. While the TFM could be performed by physically transmitting focused acoustic beams at all positions over the region of interest, the time required to complete such an acquisition cycle is prohibitively long.
Because the acoustic waves used in NDT applications are linear, the physical superposition of acoustic waves producing a specific beam in transmission and reception (beamforming) can be replicated by a post-acquisition summation. To perform the TFM synthetic beamforming, which corresponds to physical beamforming, it is necessary to acquire all the elementary A-scans from the transmission and reception apertures of a probe. This complete data set of elementary A-scans is needed to compute all the focused beams. Full matrix capture (FMC) acquisition is used to gather this data set.
Q: How does the TFM work?
A: First the user enters the parameters that delimits the TFM zone, which is the targeted inspection area, or region of interest (ROI). The TFM zone is divided into a grid, and the size of each position (or pixel) in that grid is determined by the user (the grid resolution). To make sense of the FMC data, the TFM algorithm inputs key variables, such as the acoustic propagation mode and resolution, dividing the data into wave sets. The TT-T wave set, for example, is one where the transmitted transverse wave reflects off of the inner surface before reaching each pixel in the ROI, and then travels as transverse wave in a direct path from each pixel to the receiving element.
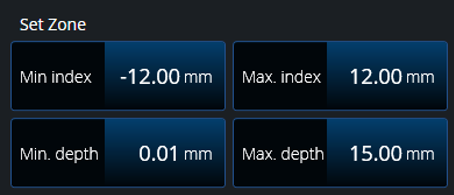 | 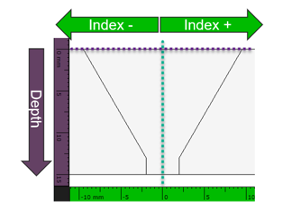 |
Setting the TFM zone parameters
Q: What is FMC, and how does it work?
A: The full matrix capture (FMC) acoustic acquisition yields an FMC data set. The FMC data set is the collection of all combinations of elementary reception A-scans obtained from the transmission of each element of a phased array probe or an arrangement of probes. The strategy involves firing each element of the probe in succession, while all the other elements receive the returning acoustic beams.
Watch the video to see FMC and the TFM in progress.
Q: Why use the TFM to process the FMC data set?
OR (vice versa)
Q: Why use the FMC strategy to produce TFM images?
Any beamforming method can be applied to the FMC data set. You could use the raw FMC data (elementary A-scans) to synthetically emulate a typical phased array (PA) acquisition. However, the PA beamforming strategy only focuses the beam at a specific depth in the part, while the TFM enables the representation of the acoustic amplitude over an entire region of interest (the “TFM zone”), and every pixel position in that area is focused. The potential to obtain a fully focused region of interest is the main motivation for using the TFM to process FMC data.
And conversely, to obtain TFM images at a rate that is efficient enough for NDT applications, it is necessary to use the FMC acquisition method. The entire set of elementary A-scans for the aperture is required to compute a TFM image. The same set of FMC data can be the source of multiple TFM images presenting different wave sets.
Q: Can I have access to the raw, unprocessed FMC (full matrix capture) data set in the OmniScan X3 series flaw detectors?
A: At the date of this posting, the answer is no. However, stay tuned, as we are continuously developing new solutions for the OmniScan X3 series!
Q: Which acoustic propagation mode should I use to image a vertical reflector?
A: Some modes (or wave sets) tend to perform better on vertical reflectors. We recommend starting with self-tandem mode using the TTT-TT or TT-T wave set. However, the catch is that one wave set usually only provides a partial view of a vertical reflector. Additional wave sets, such as the TL-T, can help fill in the imaging gaps left by the first mode selected, while pulse-echo wave sets such as T-T and TT-TT can be used to detect corner trap echoes and diffraction tips.
A way you can help ensure proper imaging and detection is to use the Acoustic Influence Map (AIM) feature of the OmniScan™ X3 flaw detector, along with experimental prove-up, to fully characterize and understand the pros and cons of each propagation mode. Keep in mind that using self-tandem modes can be challenging, since the inspected material’s thickness and velocity need to be accurately assessed to obtain expected results.
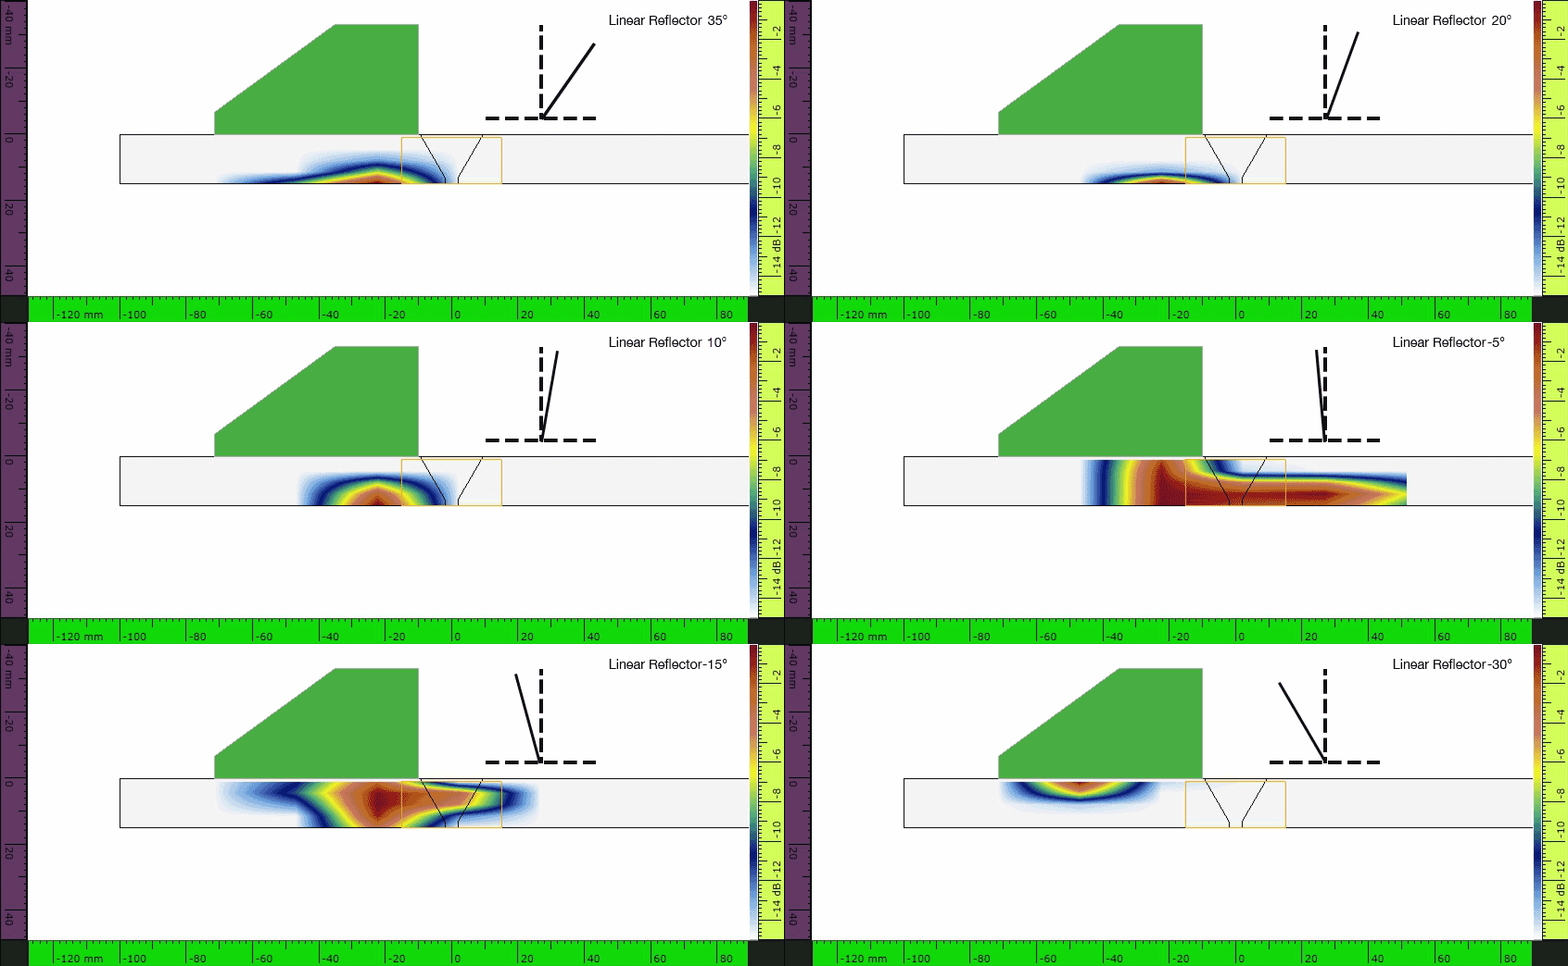
Learn more about the Acoustic Influence Map in this white paper: “TFM Acoustic Influence Map.”
Q: Can I use the HydroFORM™ scanner with TFM?
A: Except for very specific applications where the water column remains constant, the answer is, unfortunately, no. It’s not possible yet to use the HydroFORM scanner with the total focusing method. Because of the acoustic velocity difference between water and the inspected material, a very slight water column variation will correspond to a relatively large deviation in the ultrasound wave’s path in the material. For example, a water column variation of 0.5 mm ultimately corresponds to a path difference of 2 mm in carbon steel, which negatively impacts the TFM focusing capabilities. However, stay tuned, as we are continuously developing new solutions.
Q: What are the benefits of the TFM envelope feature on the OmniScan X3 series?
A: The most evident benefit of using the TFM envelope is to discard the amplitude oscillations resulting from the use of naturally oscillating acoustic wave A-scans as the basic data set. Free of the oscillations, the amplitude becomes more continuous, and the sizing easier.
Also, the TFM envelope image can be obtained at a higher acquisition rate than the standard oscillating TFM while maintaining the same amplitude fidelity (AF) value. The examples below show high-temperature hydrogen attack (HTHA) defects with the envelope off (top) and on (bottom). When the TFM envelope feature is on, the grid resolution can be coarser, yet the amplitude fidelity remains under 2 dB (the standard tolerance) and the acquisition rate increases. In comparing these two images, defect echoes can be more easily identified with the envelope activated. Because it is more robust against oscillations, the TFM envelope image can help ease flaw interpretation and amplitude-based sizing.
Learn more about the TFM envelope in this white paper: “Use of the Total Focusing Method with the Envelope Feature.”
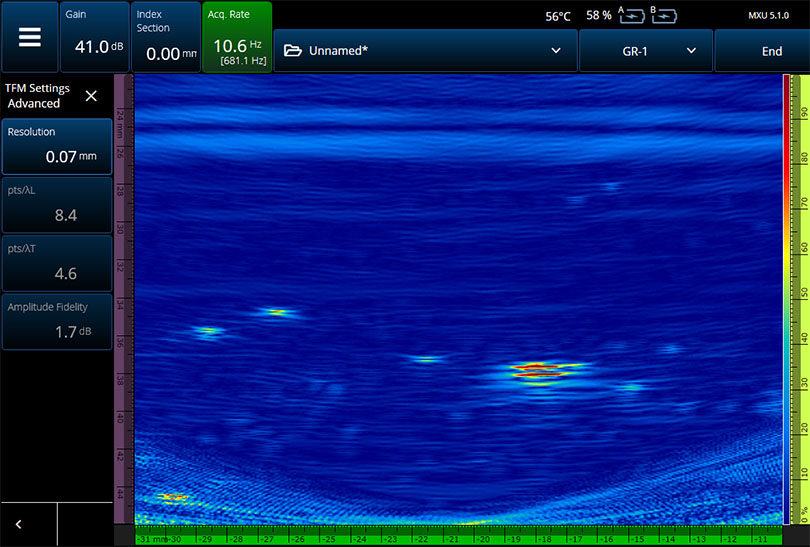
Standard TFM image of HTHA flaws with a 0.07 mm grid resolution, 1.7 dB AF, and 10.6 Hz acquisition rate
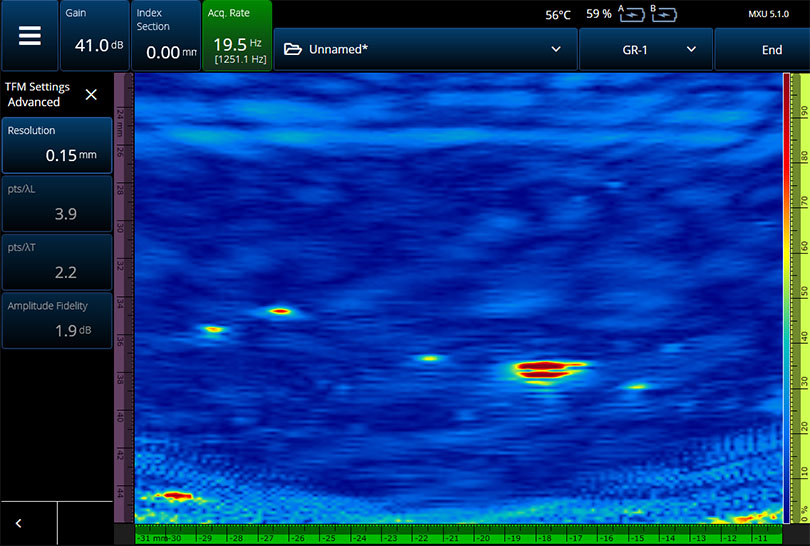
TFM envelope image of HTHA flaws with a 0.15 mm grid resolution, 1.9 dB AF, and 19.5 Hz acquisition rate
Q: Why is TFM able to use active apertures that contain double the number of elements of PA when using the same instrument model and probe?
A: This is possible because TFM imaging is produced using FMC data. The FMC data collection in an OmniScan X3 series flaw detector can be split into two portions when required; for example, if you're using a phased array probe containing 128 elements with a 64-channel flaw detector such as an OmniScan X3 64 model.
How it works: First, the instrument pulses a single element and receives the returning ultrasound on the first half of the elements. Then, it fires that element again, receiving this time on the second half of the elements. This twofold firing sequence repeats for every element in the probe, gathering the data from all the elements very rapidly.
To compare TFM with PA, let’s reuse the example of an OmniScan X3 64 flaw detector with a 128-element probe. Using the PA acquisition mode you are only able to pulse/receive 64 elements of the probe at once. PA signal processing is limited by the number of channels in the flaw detector, which is 64 in this case. Since the TFM processing is based on the FMC data, which can be acquired using all 128 probe elements, it effectively doubles the active aperture compared with PA.
Q: In the scan plan, why do I see a color map of my beam in TFM mode but not in phased array ultrasound mode (PAUT)?
A: At the date of this posting, the AIM feature (Acoustic Influence Map) is available only in TFM mode. However, stay tuned, as we are continuously developing new solutions!
Q: Why would I want to reduce my grid resolution?
A: While a very high pixel count (high grid resolution) might improve the TFM image, the processing burden will cause the acquisition rate to decrease. So, users should target a “sweet spot” that provides good detection and characterization capabilities without sacrificing productivity. OmniScan X3 series flaw detectors include some helpful readings that provide insight into the grid resolution in function of the probe’s central frequency wavelength in the specimen, both for the transverse wave (T-wave) and longitudinal wave (L-wave). Another reading provides a theoretical amplitude fidelity (AF) value in function of the acoustic mode selected and grid resolution. This reading is quite useful as some new FMC/TFM codes and standards require the operator to define the grid resolution to get an AF level of 2 dB or lower. This helps operators avoid the cumbersome process of measuring the AF value experimentally.
Q: What is the difference between pulse-echo, self-tandem, and pitch-catch propagation modes?
A: Pulse-echo is any propagation mode where the transmitted beam and the reception beam follow the exact same path in the inspected piece. Pulse-echo modes can be achieved in a direct path (no skip) or with multiple skips. They are defined by the mode of the acoustic wave, longitudinal or transverse (L or T), of each leg of the propagation path: L-L, T-T, LL-LL, TT-TT, etc.
Self-tandem mode transmission and reception propagation paths do not match exactly, but the transmitting and receiving elements are on the same phased array probe. In its simplest form, one segment of the propagation path, either the transmission or reception path, skips at the bottom of the inspected piece, and the other propagation path, respectively the reception or the transmission path, is direct. The detection zone occurs at the crossing of both paths. Like pulse-echo modes, self-tandem modes (or wave sets) are defined by the mode of the acoustic wave of each leg of the propagation path: TT-T, TL-T, etc. Self-tandem propagation modes also include wave sets with multiple skips, such as the TTT-TT.

Typical pulse-echo propagation paths (three images on the left) and a self-tandem propagation path (image on the right)
Pitch-catch mode is defined in the same way as the self-tandem mode, only with the distinction that the transmitter and receiver elements are on two different phased array probes.
Pulse-echo and self-tandem propagation modes are not specific to the TFM: they can be obtained in conventional phased array as well as the total focusing method.
In pulse-echo TFM, thickness variations in the part only affect the position of back wall signals and ID-connected indications. Contrary to pulse-echo TFM modes, self-tandem TFM modes are highly sensitive to slight changes in part thickness because of the small overlap between the transmit and receive focal spots. Thickness variations as little as 5% can put self-tandem TFM indications “out of focus,” so it is important to measure precisely the actual part thickness.
Q: Can I use a wedge when inspecting in TFM mode?
A: Absolutely! Just like with PAUT, you can use a probe with TFM with or without a wedge.
Q: Where does my A-scan come from in TFM mode?
A: The A-scan presented next to the TFM “end view” is from the reconstructed TFM image and not from the FMC elementary A-scan data set. The TFM A-scan represents a matrix of pixel amplitudes that are selected/shown. This is why the A-scan in TFM is referred to as a synthetic A-scan rather than a summed A-scan like in PAUT.
Q: Is TFM better than phased array ultrasonic testing (PAUT)?
A: Whether the total focusing method is better than PAUT is a matter of application and preference. Are apples better than oranges? Anyone who prefers one over the other can argue that apples are better suited for apple pie or oranges make better orange juice. The principal differences between PAUT and TFM are listed below:
- Focus: Conventional PAUT produces beams that are focused at one depth. TFM is engineered to be focused everywhere. However, the TFM is based on the same acoustics permitting the deployment of PAUT: the same laws of physics apply to both PAUT and TFM and affect the beamforming in exactly the same manner. Accordingly, one fact that is often overlooked, especially for TFM, is that the method only works in the near-field region. In the PAUT focused region, the TFM and PAUT performance should be quite similar. Note that PAUT provides extra flexibility as it can be operated unfocused (for screening purposes) or focused (for accurate sizing).
- Detection: Both TFM and PAUT can provide an equivalent or better detection performance than the other, depending on the application. The ability of TFM to focus everywhere can help resolve smaller indications, such as inclusions and porosities, without the need to adjust the focus in relation to the detected flaw’s position. The different TFM modes and wave sets exhibit very different sensitivity patterns. Finally, the TFM is also very sensitive to defect orientation—since it is, after all, an ultrasound technique. Operating TFM inspection without knowing the influence of each of the above variables can lead to a poor detection performance. The best way to ensure good detection is to generate a simulated sensitivity map (such as the AIM feature of the OmniScan X3 flaw detector) and to support the simulation results with prove-up testing. Alternatively, PAUT detection capabilities are well known, since the technique has been in use in NDT for decades. PAUT is recognized as offering excellent detection and sizing of various types of cracks and lack of fusion, but is accepted as less effective on smaller indications, such as isolated porosities. The above statement is “generally true,” but only because most PAUT inspections are initially performed unfocused (for screening purposes). When using PAUT in focused mode, combined with an appropriate, good-quality probe and wedge, you can produce results that are as good as TFM. However, this only applies to the area where the beam is focused.
- Speed: As FMC acquisition typically pulses each element successively, and PAUT uses a limited number of beam sets (focal laws), the PAUT is generally faster. Additionally, the TFM requires real-time intense processing, which slows down the acquisition further—something that PAUT instrumentation does not require. Generally speaking, PAUT can provide much faster acquisitions than TFM, but only focusing at a single depth. Note that the use of the TFM envelope can improve the acquisition speed with respect to standard TFM, while maintaining the amplitude fidelity value at an acceptable level.
- Scan plan and simulators: The OmniScan X3 flaw detector is equipped with a helpful simulation tool called AIM, which stands for Acoustic Influence Map. It shows you the coverage that is offered by each wave set to help you select which FMC data to save. Both TFM and PAUT ensure proper coverage in their own ways, so it’s important to learn about each to obtain reliable results for that method (see “Training” below).
- Training: Both TFM and PAUT require proper training to be used effectively. The scope and time recommended for training for each technique are nearly equal. Misconceptions such as “anyone can setup a box with TFM” or “you can just beam every angle with PAUT” contribute to people misunderstanding these technologies. This can lead to false calls, and the only way to prevent this is proper training.
- Historical presence and field proven: PAUT has been used successfully in NDT for more than two decades and has established used cases, capabilities, and limitations. Alternatively, TFM is an emerging technology offering a wide range of possibilities that the industry has yet to fully exploit.
- Adjusting on the spot: Both TFM and PAUT enable users to make on-the-spot setting changes.
- Calibration: Both TFM and PAUT require proper sensitivity calibration to ensure that defects will be detected across the entire targeted range (or zone).